

Having an effective project management system is crucial to succeeding in many jobs across many industries. Whether you’re just keeping track of your own tasks or tracking initiatives across an entire company or organization, it’s important to keep your work on track and on schedule.
In this guide, we’ll take a look at Spreadsheet.com’s Project Plan template and review how key Spreadsheet.com features like Gantt views, Charts, Automations, and more can be used together to create an all-in-one project management solution. Take a look at our project management workbook and follow along, or create a copy for yourself to experiment.
Keeping your project on track is the bedrock of any good project management strategy, and the first step of managing a project is compiling a task list with projected dates and other key information.
With Spreadsheet.com’s Gantt views and Calendar views, you can easily transform your task lists into interactive timelines and give your team more ways to keep projects on track.
Before creating a Gantt view or Calendar view, we’ll give our task list some more structure by creating row hierarchies, or parent-child relationships between rows. By introducing row hierarchies to our task list, we can break categories of tasks or scopes of work down into individual action items.

Here, “Subtask 1” is a child row of “Task 3”, which itself is a child row of “Scope 1”. When we enable Project Management settings, parent rows will automatically aggregate information like minimum start dates and maximum end dates from the child rows that belong to them.
When we add a Gantt view to our worksheet, we transform our simple task list into an interactive timeline to better visualize our project’s status. By adding a Gantt view, Spreadsheet.com will automatically enable Project Management settings and add timeline-specific columns – like start and end dates and durations – to your worksheet.
Spreadsheet.com uses the information in these Project Management columns to create your Gantt view, where your task list lives side-by-side with an interactive Gantt chart. The Gantt view in our workbook is color coded by Column B - Status, a Select column.
Gantt views in Spreadsheet.com are dynamic and will automatically update to reflect changes made to your task list. They can also automatically calculate a project’s critical path and let you create and manage task dependencies so you can focus on the most important parts of your project plan.
Once you’ve added a Gantt view to your task list, it’s easy to add a Calendar view as well. Like Gantt views, Calendar views are dynamic and help you quickly reference your project’s schedule.
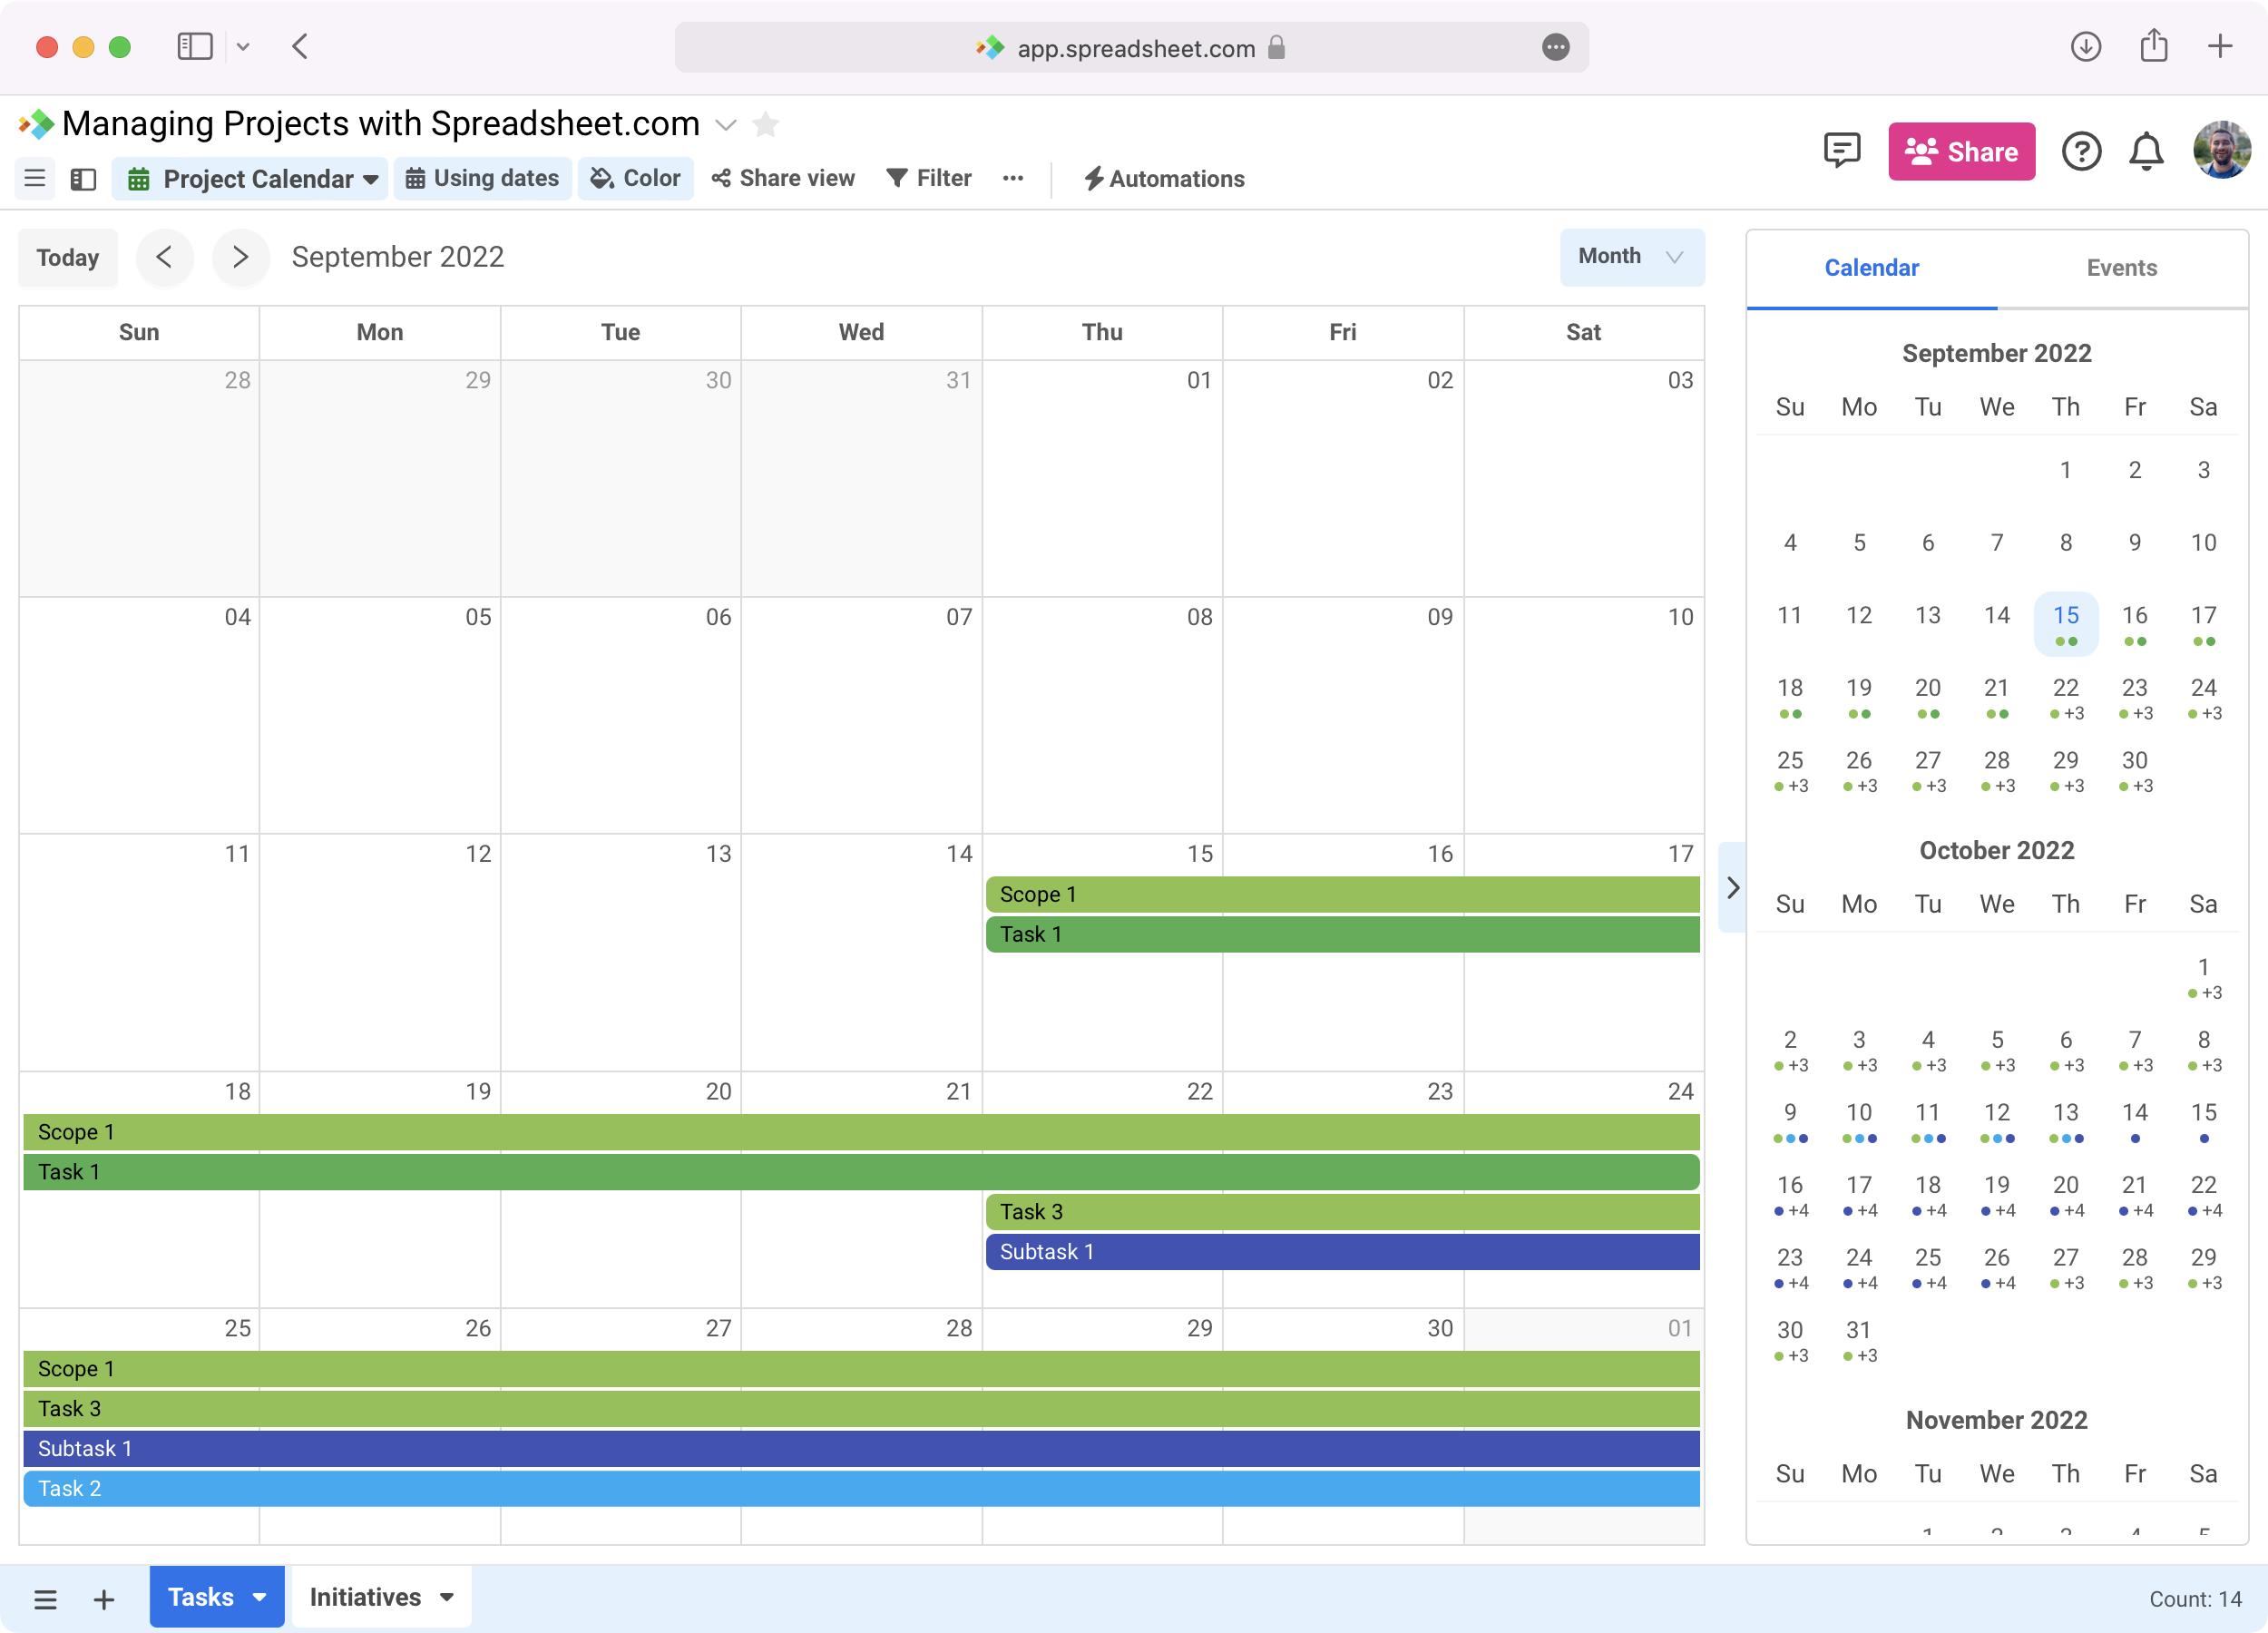
Here, we’re using a Month view to see a high-level overview of our project timeline. We can also use a 2 week or 3 week view to take a closer look at our project schedule.
With Automations, we can automatically notify our team of upcoming or overdue tasks and more easily keep our project on track. In our automation, the When a Date arrives trigger and Send notification email action work together to notify our team on the day that a task is scheduled to begin.

Here, our trigger is configured to occur on the day a task begins in Column E - Start Date. Once the automation is triggered, Spreadsheet.com will send an email notification to the task owner and workbook owner. The email is customized with information taken directly from the Tasks worksheet.
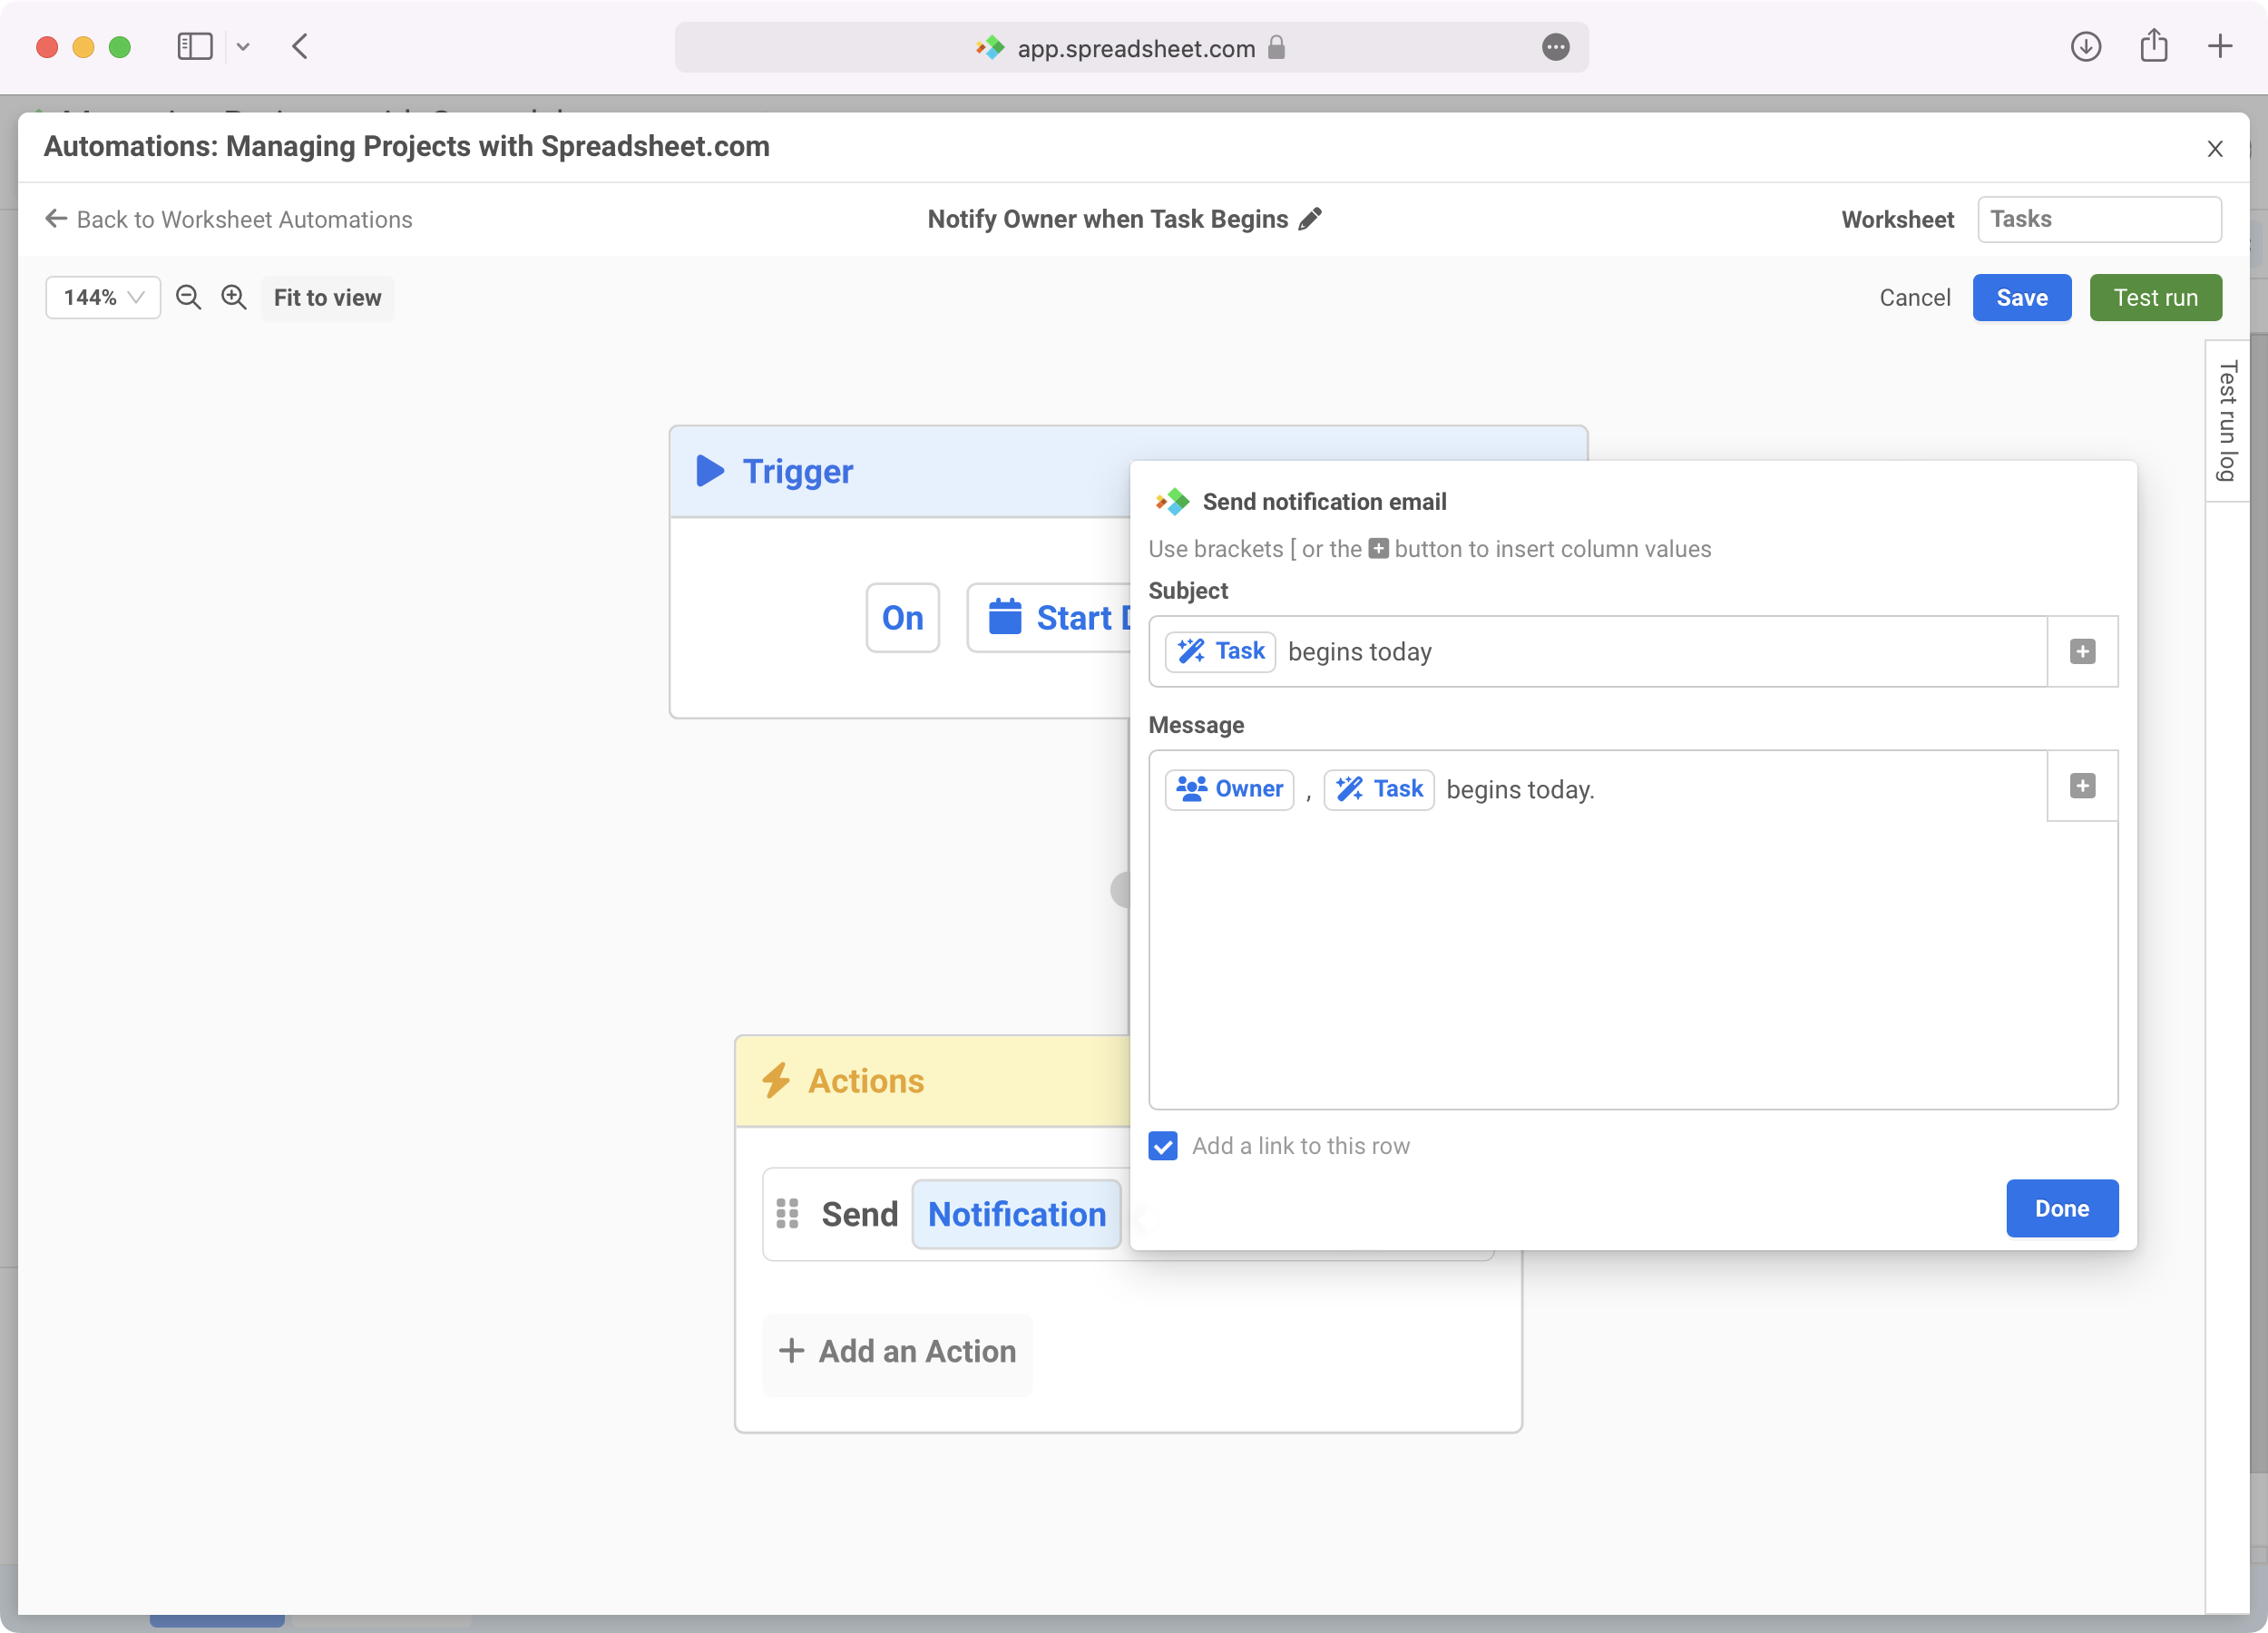
We could also choose to notify our team via another service like Slack or Microsoft Teams, or send them an email notification reminder on a task’s end date to make sure that it’s been completed on schedule.
Focusing on specific parts of your project plan can be important, especially if your project involves dozens or hundreds of tasks. With features like row grouping, filtering, and support for an unlimited number of views for each sheet, Spreadsheet.com makes it easy to break your project down in a number of ways.
By applying a filter to our worksheet, we can view tasks that only meet certain criteria. In our “Action Items” Sheet view, we’re using a filter that removes tasks that have the status of “Planning” or “Completed” in Column B - Status, allowing us to focus only on ongoing tasks and our current action items.
Spreadsheet.com lets you create as many views as you want, so we could create another that shows only “Completed” tasks, and another that filters out any “Delayed” tasks. We could also opt to filter our view by a different column altogether and create a view that just shows tasks beginning in September (filtered by Column E - Start Date) or those with a duration of longer than one week (filtered by Column G - Duration).
Like filtering, row grouping can also help us focus on relevant information in our worksheet. Row grouping allows you to divide your worksheet into groups of rows that share common information in one or more columns.
In our “Tasks by Owner” Sheet view, we’re using row grouping to divide up our task list by Column C - Owner and give each task owner their own group of rows.
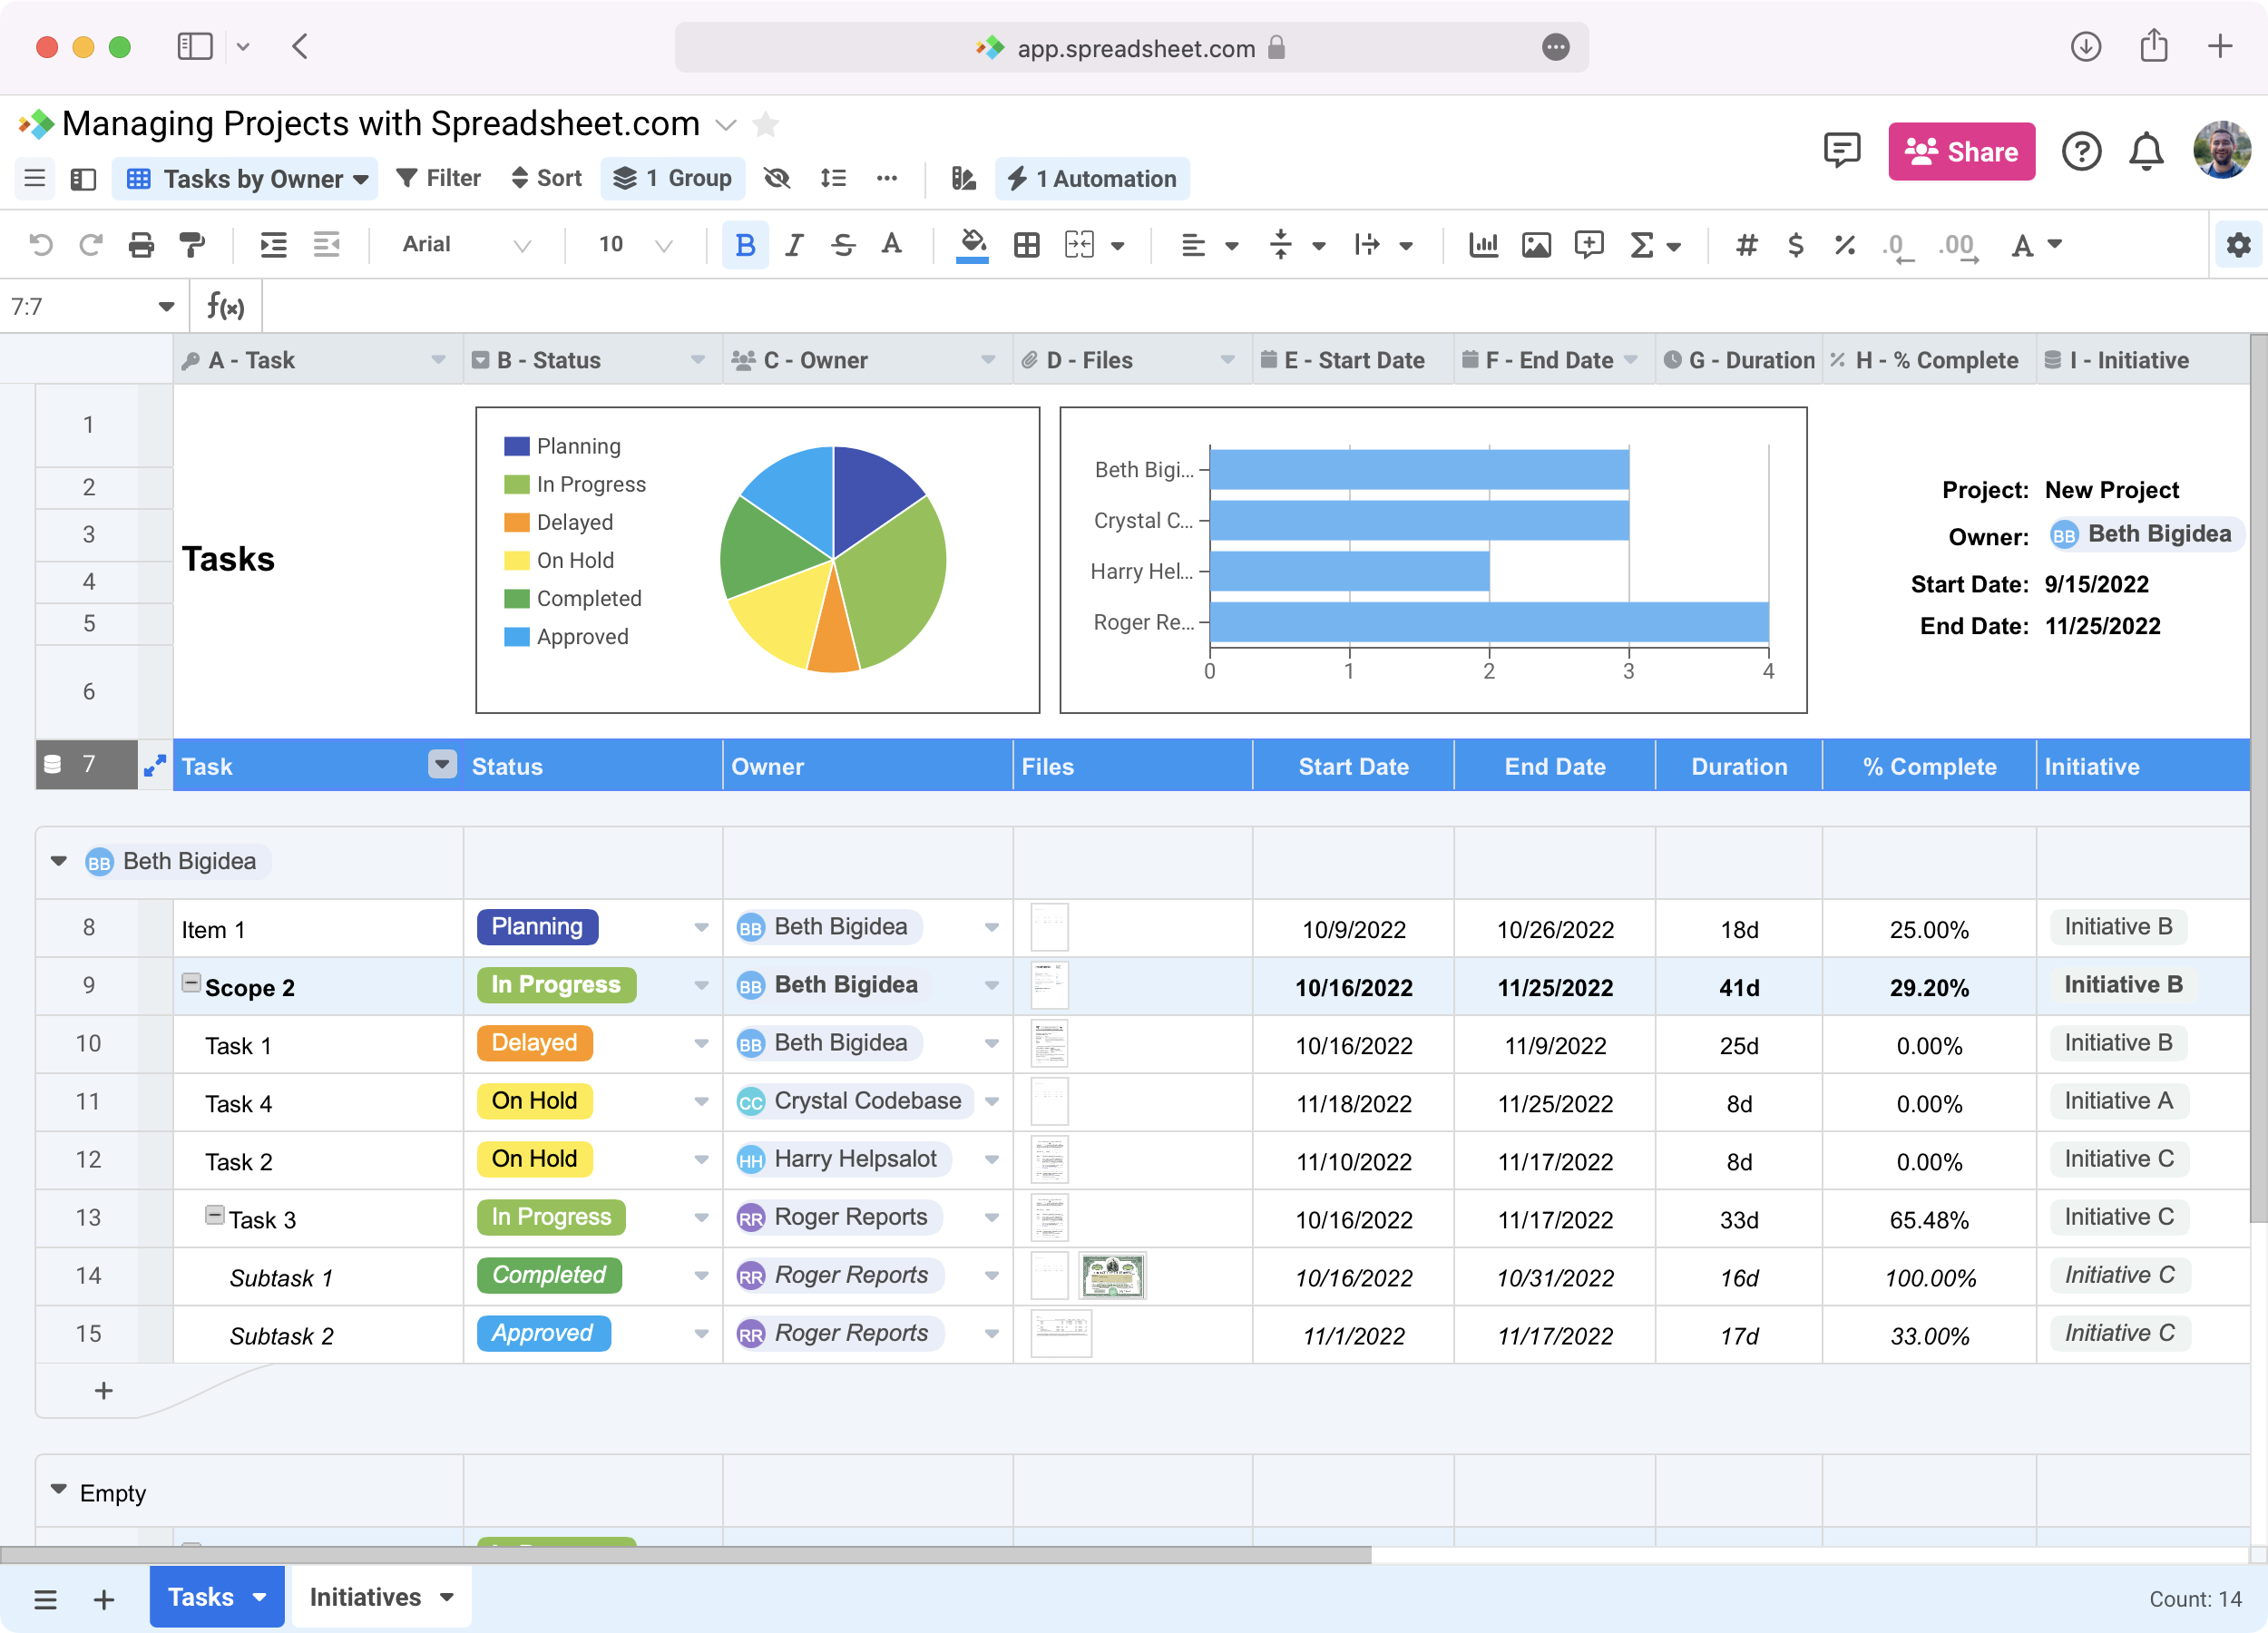
Once row grouping has been applied, we can use each group’s summary header row to quickly generate aggregate information like the count of each owner’s tasks or the sum of the duration of all of their tasks.
As with filtering, we could create another view that uses a different column by which to group our rows, like one that groups our sheet by Column B - Status or Column J - Initiative.
Adding charts to your project management workbooks can help you quickly reference important metrics like workload, the distribution of tasks across teams, or the number of tasks that are completed compared to those in progress.
Like traditional spreadsheet software, Spreadsheet.com supports more than a dozen different types of charts.
In our Tasks worksheet, we’ve added a Bar Chart to the table header region that displays each team member’s workload, calculated as a count of the tasks assigned to them. We’ve also added a Pie Chart showing the distribution of tasks by Column B - Status.
Ready to get started? Browse Spreadsheet.com’s Template Gallery to find ready-to-use project management templates, as well as templates for construction project management, sales, finance, and more.