
Addressing IT issues quickly is important to maintaining an organization’s efficient operations. Between software and hardware, many organizations encounter hundreds – if not thousands – of technology touchpoints daily. When issues arise, IT and operations departments need robust systems to receive and process support tickets.
In this guide, we’ll take a look at Spreadsheet.com’s Support Tickets with Form template and explain how key Spreadsheet.com features like Form views, data types, and charts can be combined to create an all-in-one support ticket management solution. Take a look at our support ticket management workbook and follow along, or create a copy for yourself to experiment.
With Form views, we can collect support tickets in the same sheet that we’ll use to triage and address them without the need for additional data entry or a separate software.
By adding a Form view to our worksheet, we can collect incoming support tickets from employees and map their responses to the worksheet’s columns.

Once we’ve configured our Form view, we can generate a public share link and distribute it across our organization. Employees can submit responses via the form whether or not they have access to our workbook or a Spreadsheet.com account. As people submit support tickets, each one will be added to our Support Tickets worksheet as a new row.
With the User data type, we can assign each support ticket to a member of our team. Here, Column F - Owner uses the User data type and is configured to automatically notify the relevant person via email when they’re assigned to a new support ticket.
Alternatively, we could use Automations to notify our team of new tickets via email or another service like Slack or Microsoft Teams. Automations can be created with different triggers that lead to these notifications, so we could choose to notify our whole team as soon as a new support ticket is submitted, or only choose to notify them when a ticket has been assigned a high priority in Column B - Priority, an Icon set column.
Notifications sent with Automations can contain data taken directly from our workbook like the text in Column C - Description and the name in Column H - Submitted by.
Once support tickets start rolling in, it’s important to have a system to manage your backlog and make sure that every ticket is addressed. With features like row grouping and Kanban views, Spreadsheet.com makes it easy to break down your backlog in a number of ways.
Row grouping allows you to create groups of rows that share common data in one or more columns. We could create groups of tickets with the same status, like in the Grouped by Status view, or we could create groups based on department, like in the Grouped by Department view.
Row groups can be created with multiple criteria and be organized into subgroups. In the Grouped by Owner view, rows are first grouped by Column F - Owner, and then further grouped by Column E - Status.
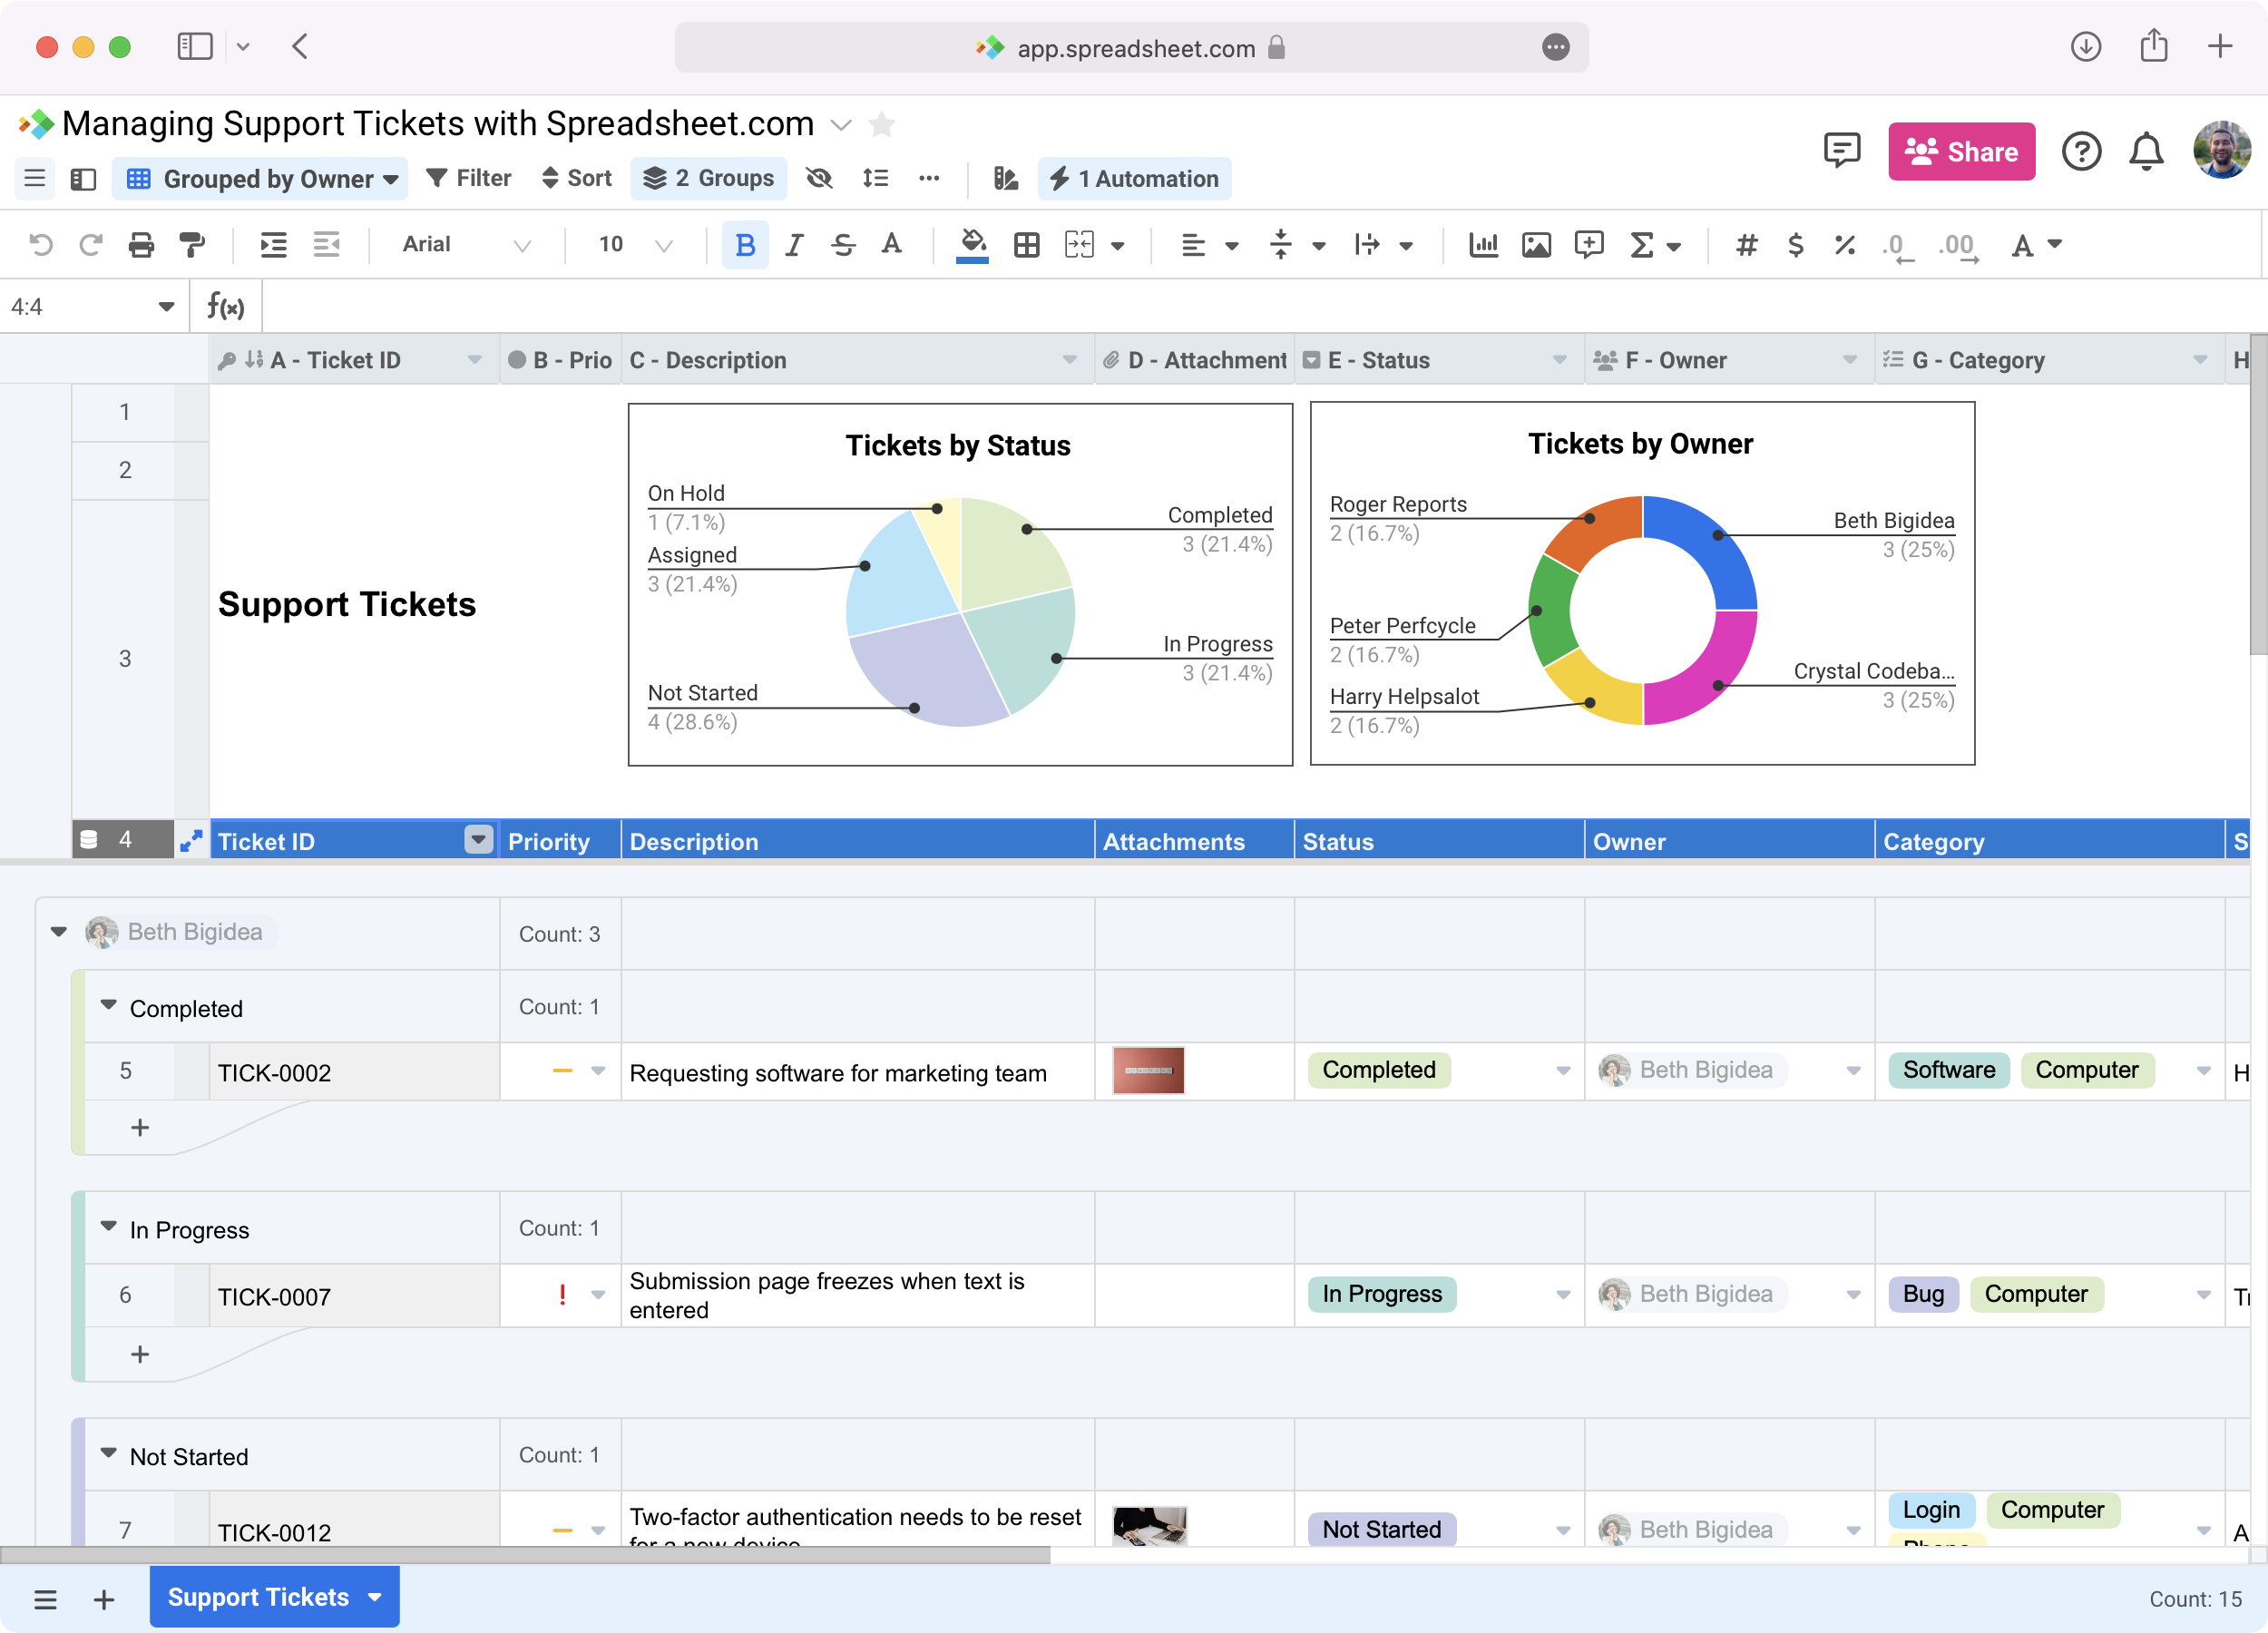
Each group’s header row can be used to display aggregate information about that group’s rows like a count of the number of tickets in the group or the average time from submission to resolution.
Spreadsheet.com lets you create an unlimited amount of views for each worksheet, so you can create as many types of row groups as you need.
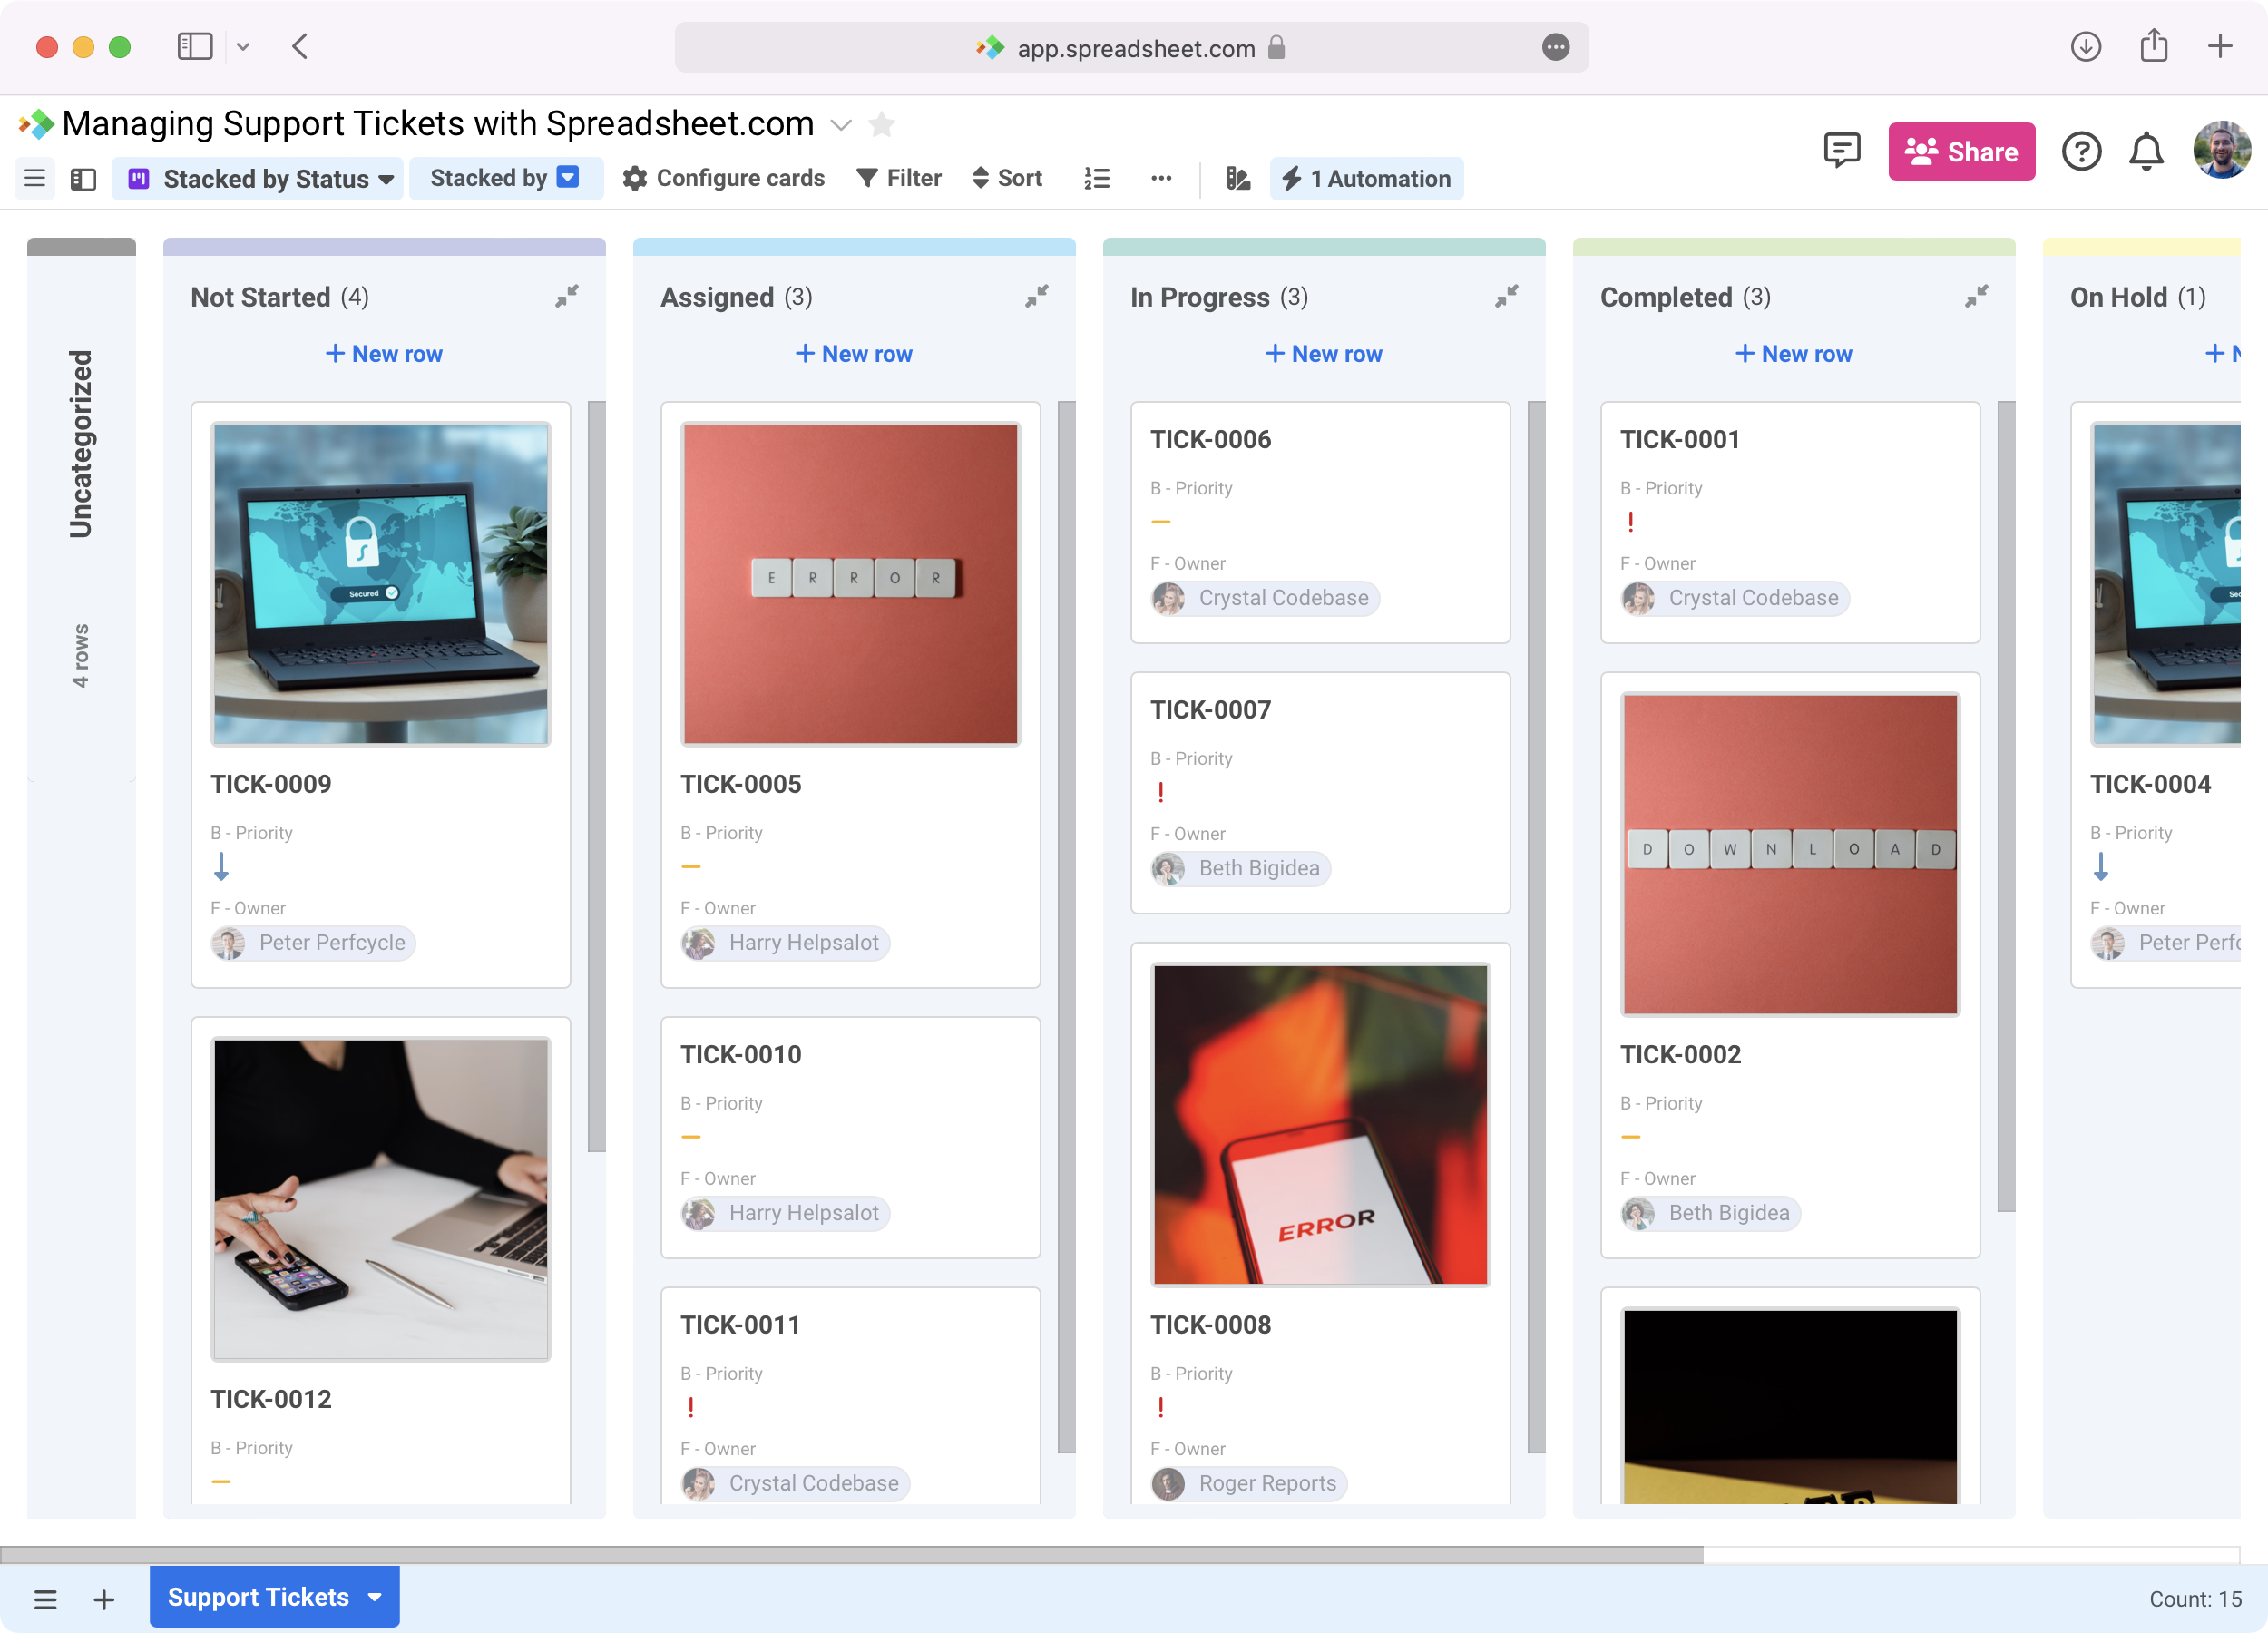
Like row grouping, Kanban views let you organize and visualize your support ticket backlog in new ways. Kanban views turn your rows into “cards” and lay them out like they’re pinned to a bulletin board.
Kanban views can be stacked by any column in your worksheet, so you can have one Stacked by Owner and another Stacked by Status. Kanban views are especially useful if you want to put attachments front and center when viewing your data.
Addressing support tickets promptly is crucial to keeping your organization running as smooth as possible. Spreadsheet.com features like charts and System data types give you more insight into your support ticket backlog and can help you optimize it.
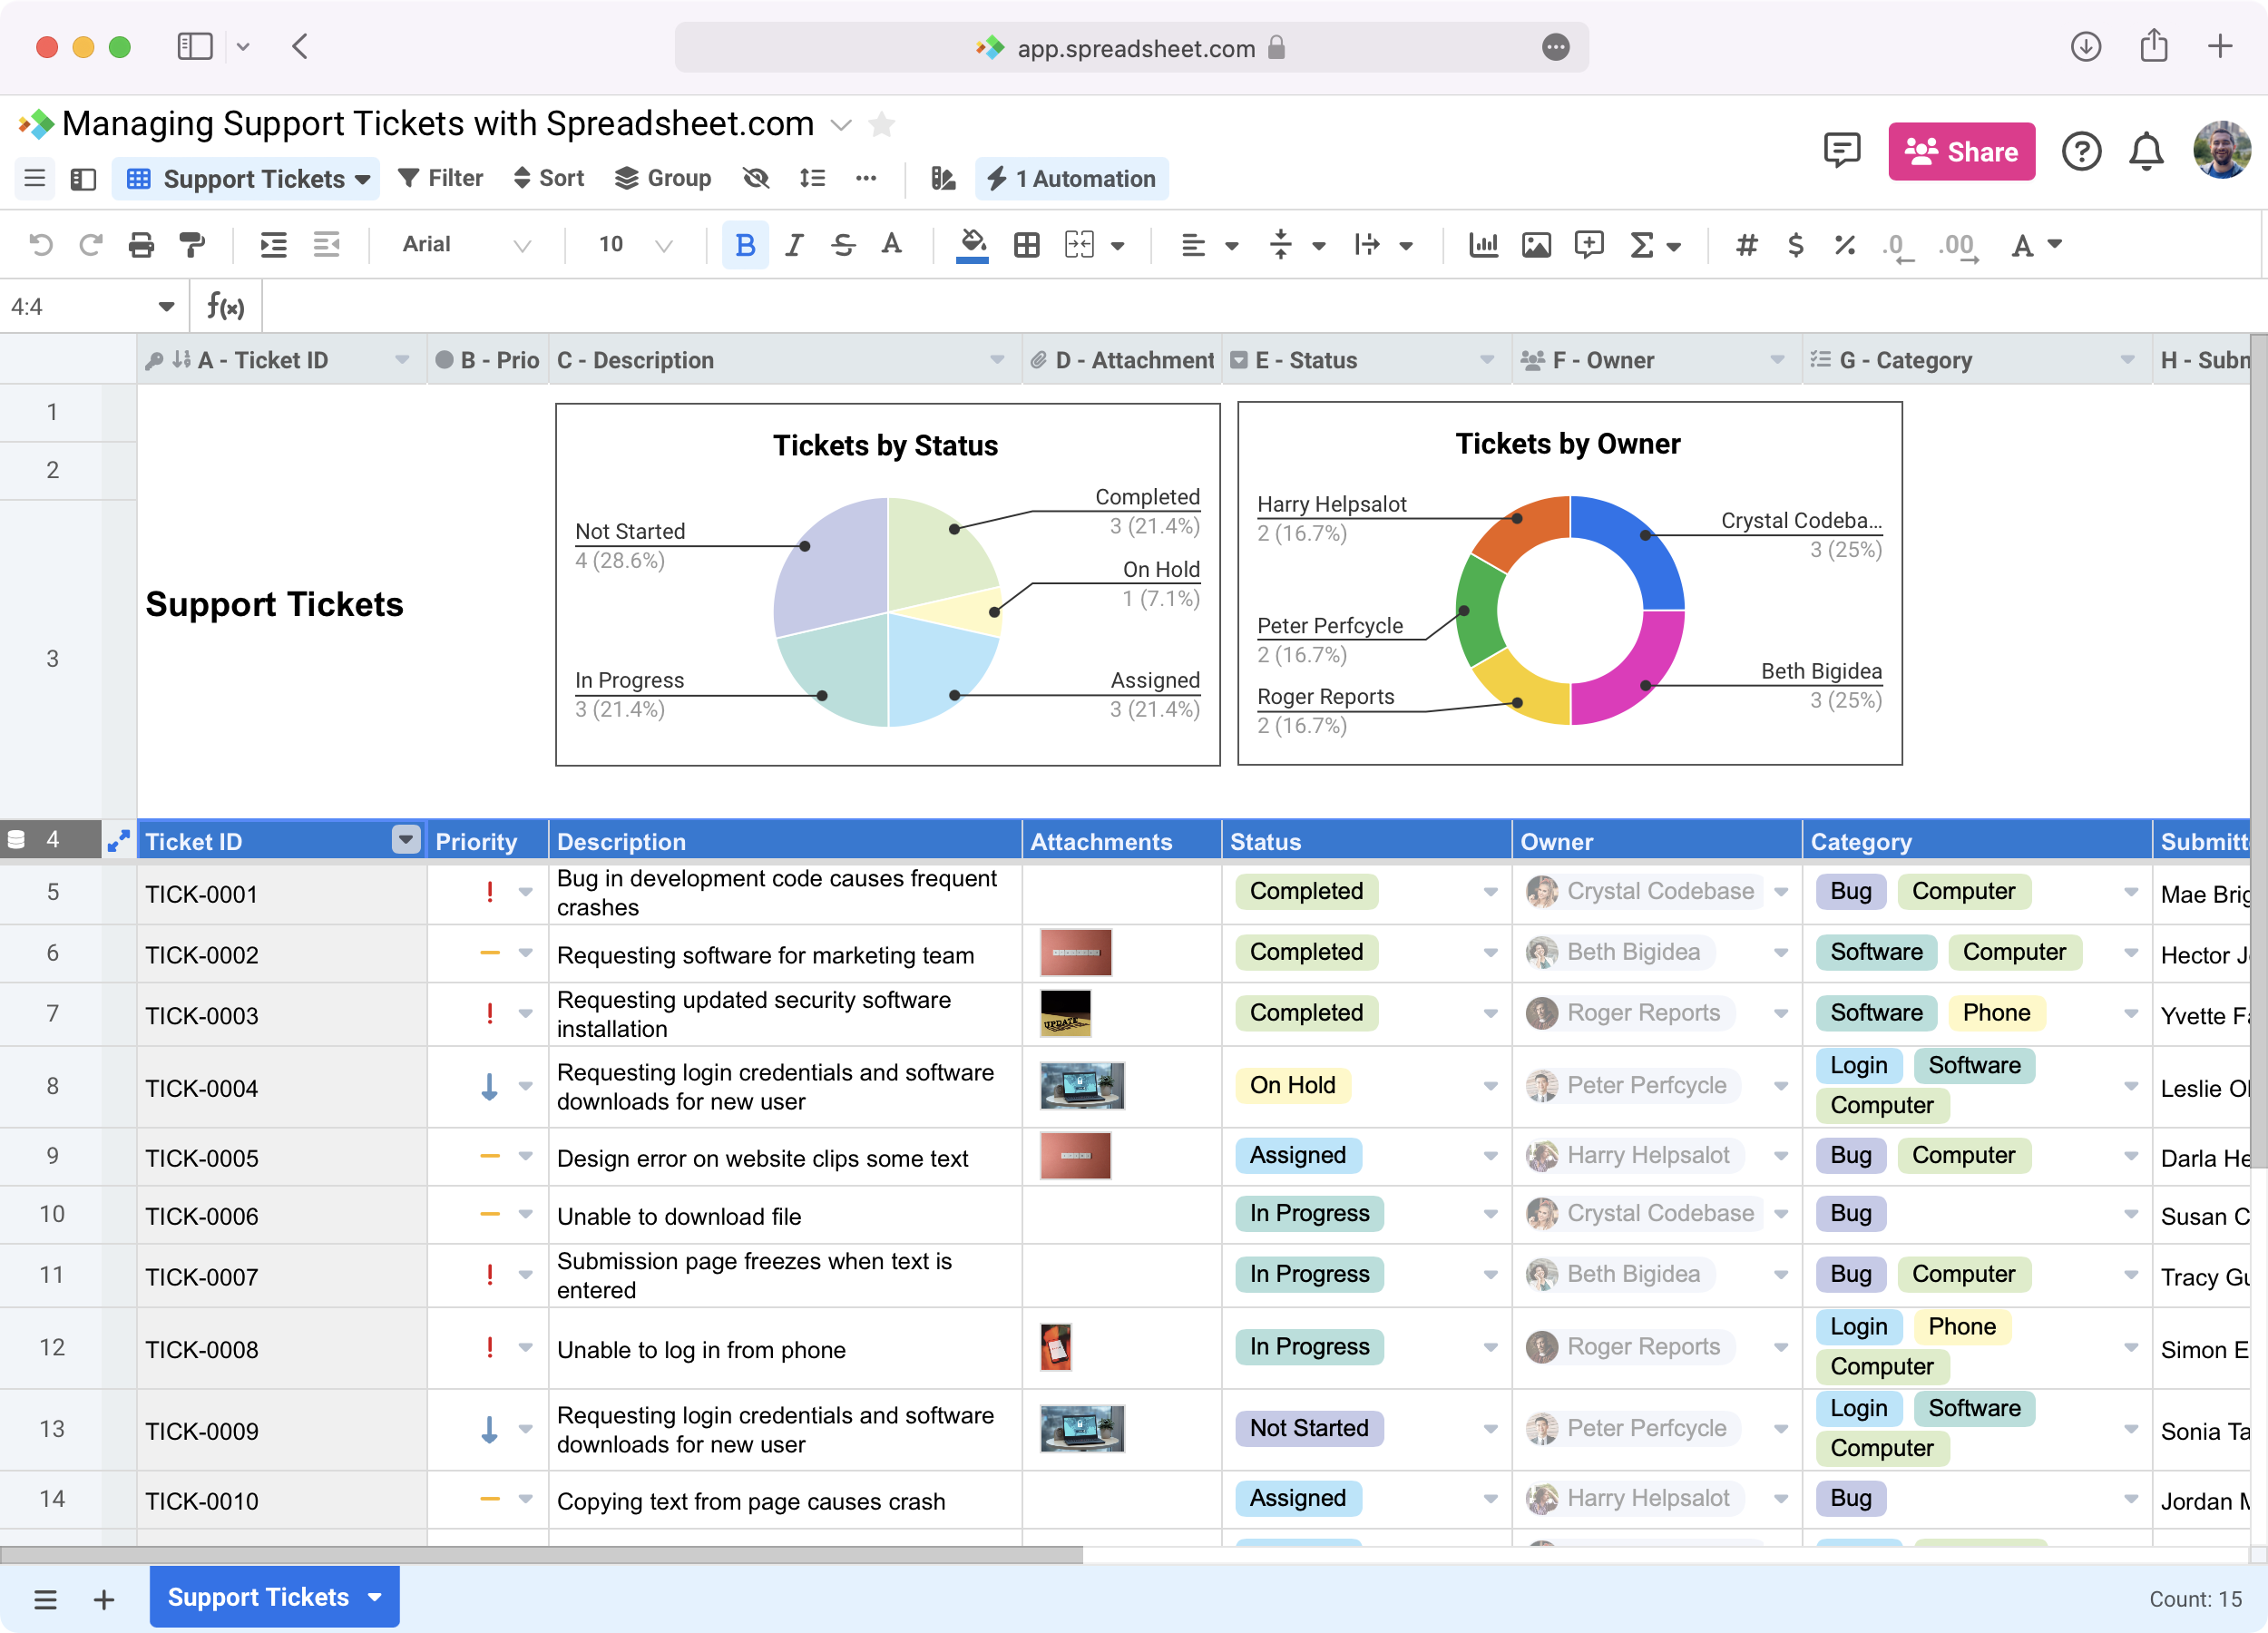
Like traditional spreadsheet software, Spreadsheet.com supports more than a dozen different types of charts. Charts can be added to any Sheet view or Gantt view.
For our workbook, we’re using a pie chart to break down our ticket backlog by Column E - Status and compare the number of tickets completed to those still in progress. We’re also using a donut chart to visualize the distribution of tickets across owners (Column F - Owner) and get more insight into the workload of each member of our team.
Having this information available at a glance makes it easier for us to assign new tickets and focus on areas of our backlog that require the most attention.
Understanding how quickly our team typically responds to tickets is just as important as knowing what’s currently in our backlog. With System data types, Automations, and the Column formula data type, it’s easy to automatically generate this information.
Column L - Submission date uses the Created at data type to automatically log the date and time that a new ticket is submitted through our form. Column M - Resolved contains the Checkbox data type; when an owner responds to a ticket, they check this column to indicate that the issue is resolved.
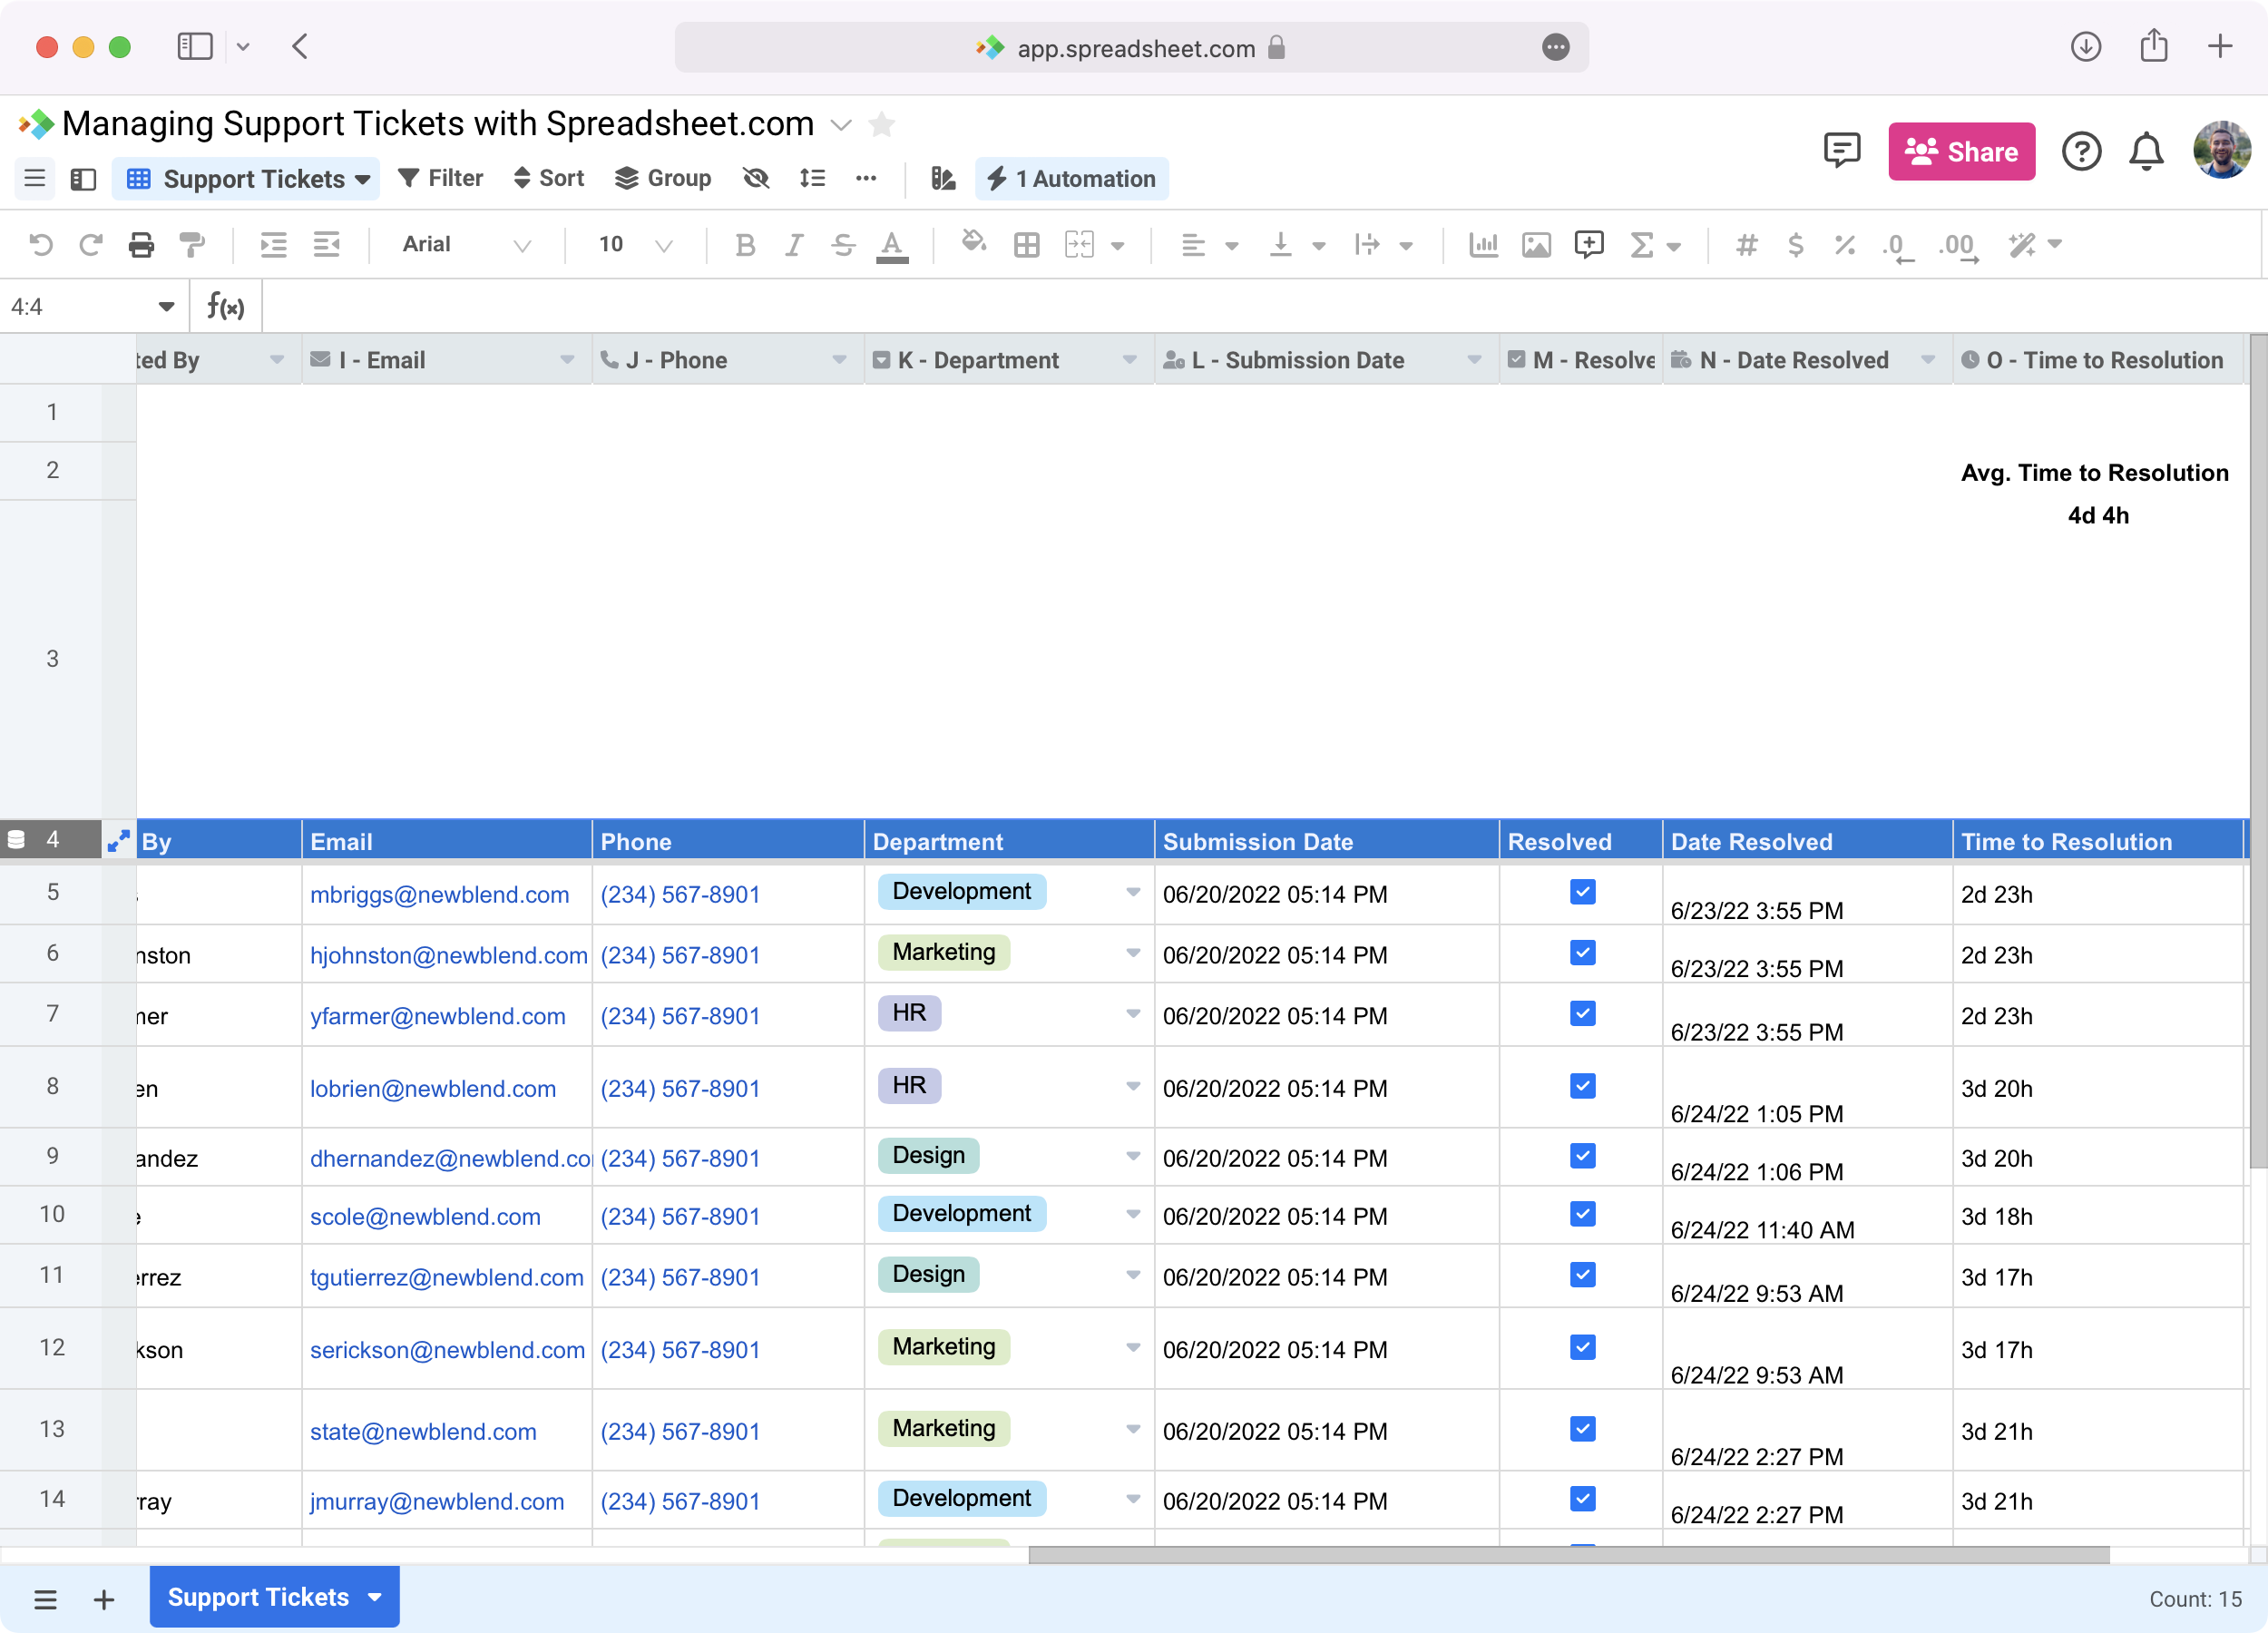
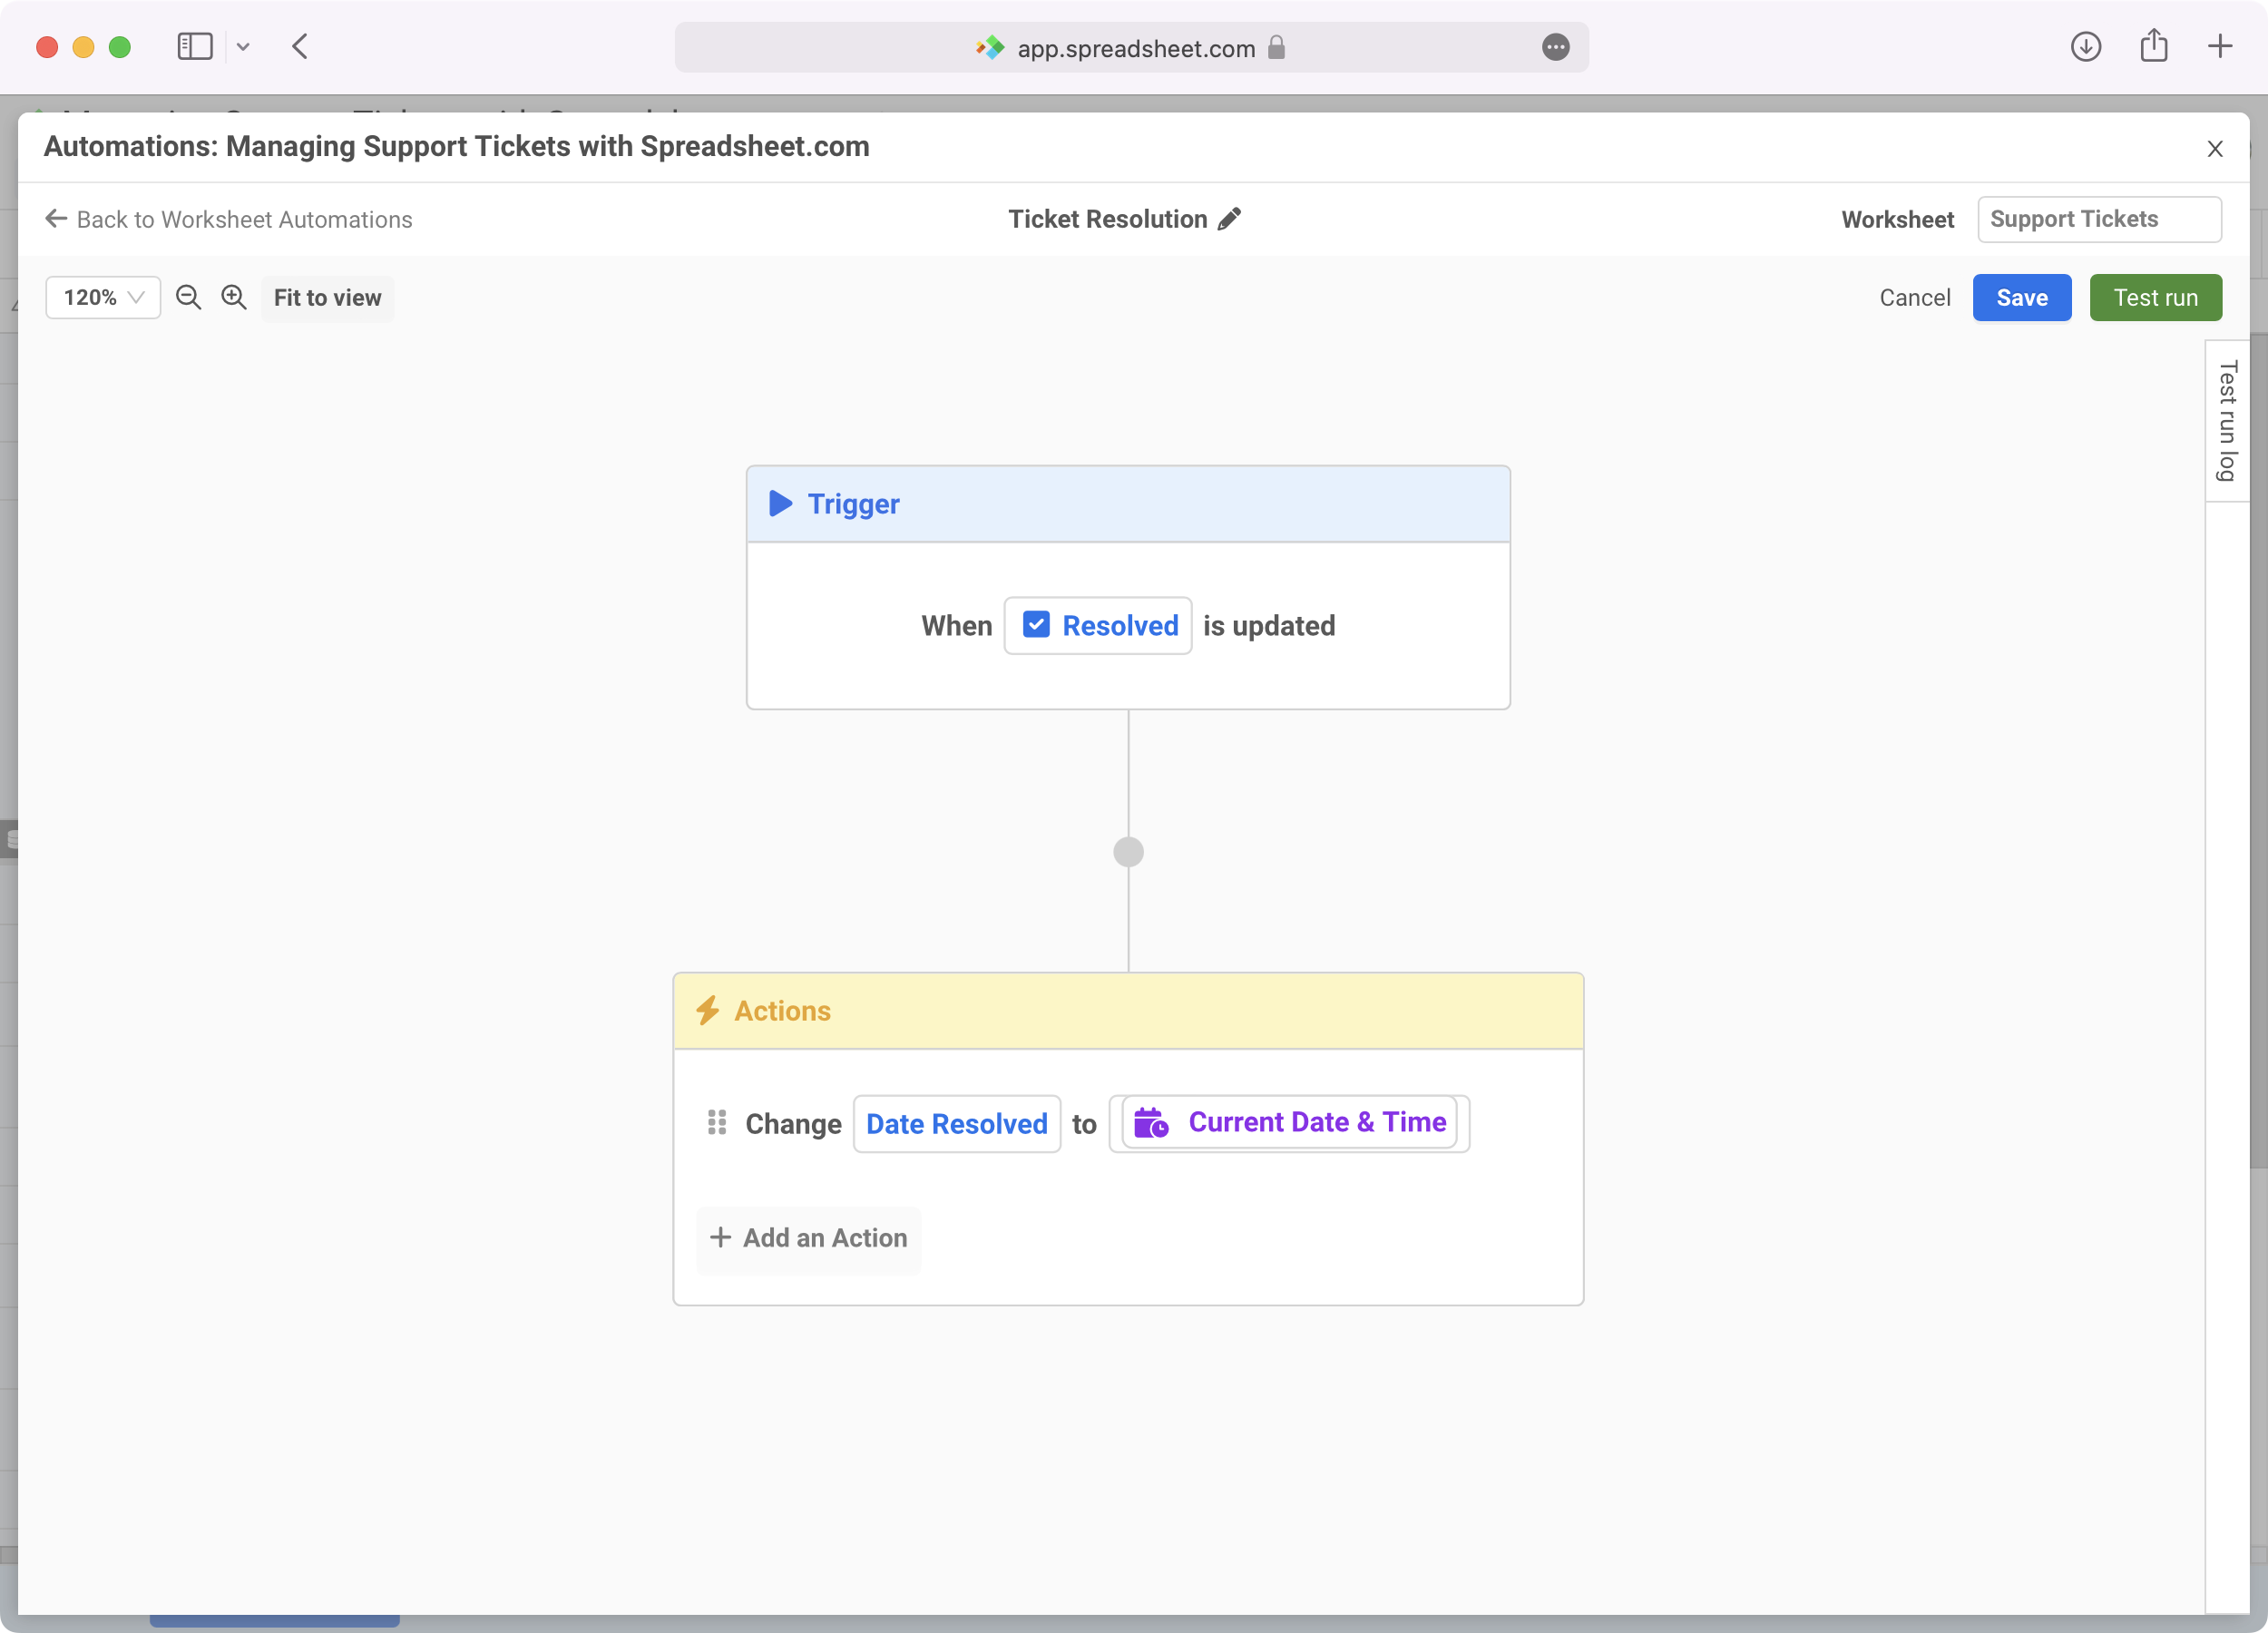
We’ve also added an automation to our workbook that automatically logs the date and time that Column M - Resolved is checked and inserts the information into Column N - Date Resolved.
Finally, Column O - Time to Resolution uses the Column formula data type to take the difference of Columns L and N to calculate the amount of time it took to resolve the ticket. Now, when an owner completes a ticket, these four columns and our automation work together to generate important new information all without the need for any additional data entry or manual calculations.
Ready to get started? Browse Spreadsheet.com’s Template Gallery to find ready-to-use IT and operations templates, as well as templates for project management, sales, finance, and more.